The Screening widget allows you to define an area of interest and analyze specified layers for potential impacts. The area of interest can be defined through a place name search, by drawing on the map, by uploading a shapefile, or by entering a traverse with coordinate and distance pairs. Analysis results can be inspected in the widget and, optionally, shared via a printed report, CSV file download, or feature download.
For examples of how to use this widget, see the Environmental Screening or Neighborhood Crime Reports solution.
Configure the Screening widget
This widget can be set to open automatically when
an app starts. To enable this feature, click the Open this widget automatically when
the app starts button  on the widget, which turns it dark
green.
- Hover over the widget and click the Configure this widget button
 to open the configuration properties dialog box.
 - Optionally click Change widget icon and replace the icon with an image of your own.
A file explorer window appears, allowing you to select a local image file to use as the widget icon.
- Click Add Layer. Each added layer specifies a feature layer in the map to be analyzed by the widget. The Screening widget supports the following layer types:
- Feature services
- Map services
Note:
Map services are supported when they are not nested in the table of contents. Nested layers are not supported.
- On the Analysis tab, optionally add a label for each layer.
- Click the edit button
 under Actions to select the fields for the analysis results.
 - Under Actions, optionally change the order of layers or delete a layer.
- Choose the tools that will be available to define the area of interest under AOI Tools and update the label.
- Optionally enable Allow uploading shapefiles to analysis.
With this option, you can add an additional layer for analysis in the widget.
- Optionally enable Do not analyze or report results for layers that are not visible.
With this option, layers that are not visible due to scale visibility settings or because they are turned off, will not be analyzed when the Report button is clicked. When layers are not analyzed because of layer visibility, they also are not included in printed reports.
- For Show areas/lengths in, specify the default units in which areas and lengths will be shown.
- Specify a value for Max features for analysis.
This parameter limits the maximum number of features returned from the configured layers and used for analysis.
- Specify the Search tolerance in feet or meters depending on the default analysis results units.
The search tolerance is used to select features when the area of interest is a point or line shape.
- Click the Download tab, and under Download Settings, choose one of the following options:
- Feature Layers—Choose the layers you want downloaded. This option supports CSV file download and, when the layer is a feature service with sync enabled, file geodatabase and shapefile downloads.
- Extract Data Task—All layers are enabled for CSV file download, and feature data can be downloaded as file geodatabases or shapefiles with the Extract Data Task geoprocessing tool.
- Disable download—No data download is enabled.
Note:
ArcGIS Data Store versions 10.6 and earlier are not supported for download with the Screening widget. - Under Report Settings, do any or all of the following:
- Update Print Service URL to use an alternate print service with the Export Web Map task enabled.
- When using an alternate print service with custom layout templates, optionally click Add Custom Layout to enable the templates to be used for the report.
A new entry will be added to the Layouts table. Populate Width, Height, and Page Units for the selected layout. These values will be used to define the report page size.
Note:
When publishing additional services for printing with ArcGIS Enterprise, ensure that the Execution Mode of the service under the Parameters section is set to Synchronous. - Change Default Layout.
- Use the Logo option to change the logo by clicking the image.
A file explorer window appears, allowing you to select a local image file to use as the logo.
- Change the default Report Title text.
- Change the Color for column titles option. This color will be displayed as the background for column titles in the printed report.
- Provide text in the Footnote text box that will be displayed as a footnote on the printed report.
- Click the General tab and update the labels used in the widget in the Area of Interest and Report panels.
- Update the default buffer settings for the widget.
- Change the symbology used to depict the buffer in the map.
- Change the symbology used to depict the point, line, or polygon areas of interest in the map.
- Click the Search Source Settings tab. To configure the Search Source Settings section, see Configure the Search widget. It follows the same configuration steps as the Screening widget.
Use the Screening widget
- Click the Screening widget button to open it.
The widget displays on the right.
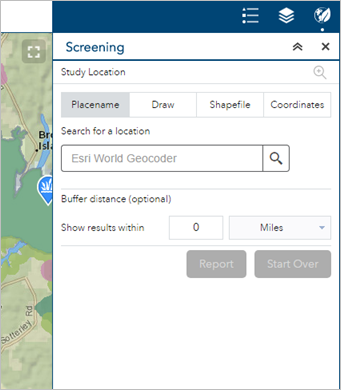
- Define an area of interest with one of the provided tools.
- Placename—Search for a location in the map, and optionally apply a buffer.
- Draw—Draw a point, line, or polygon on the map or select a feature from the map, and optionally apply a buffer. Use the Choose selectable layer list to define the layers that are selectable in the map.
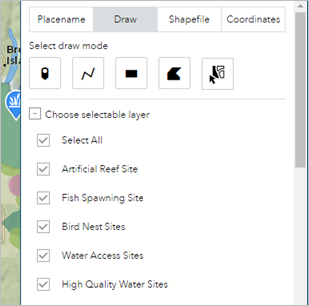
- Shapefile—Upload a zipped shapefile, and optionally apply a buffer.
- Coordinates—Identify a starting point for a traverse by searching the map, specifying a coordinate pair, or drawing a point on the map. Specify bearing and distance pairs to define the traverse.
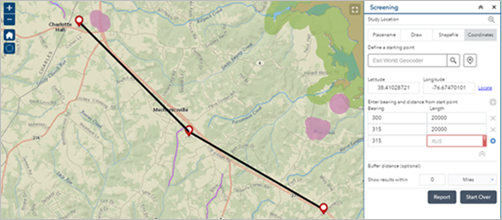
- Define a buffer.
- Click Start Over to remove the defined area of interest and create a new one.
- Click Report to analyze the configured layers within the area of interest.
Analysis results are presented in the panel. Layers with data intersecting the area of interest report a total feature count, and results are presented by grouping unique attribute combinations with the following information:
- Area of overlap when the area of interest is a polygon
- Length of overlap when the area of interest is a polygon
The areas and lengths are calculated by performing a clip analysis on the intersecting geometries in the coordinate system of the web map. If the underlying map or feature service has a spatial reference other than that of the web map, the transformation of the data is handled by the service. If the web map is using the Web Mercator coordinate system, all geometry operations are performed using geodesic lengths and areas; otherwise, planar lengths and areas are used.
Explore the results
- Expand the result details by clicking a layer. The layer details expand as shown in the following screen capture:
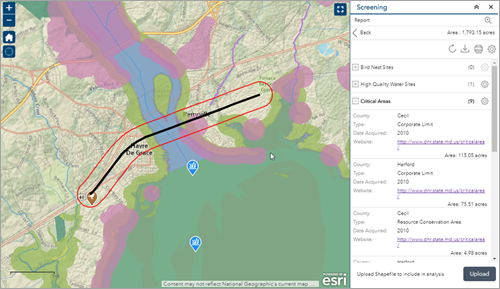
- Click the settings button to choose the fields that are presented with the results.
Note:
When all fields are disabled, the layer will be hidden in the printed report.
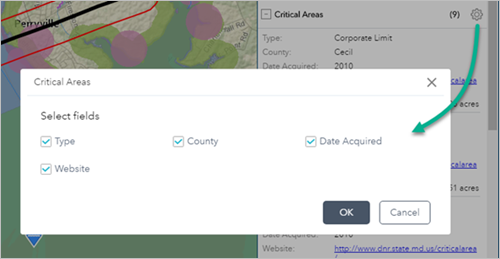
- Optionally add an additional layer for analysis by clicking the Upload button.
A file explorer window appears, allowing you to select a local zipped shapefile.
- Optionally change the units of the analysis results by clicking the Choose units for analysis button.
A window appears, allowing you to choose the length and area units for analysis results.
- Optionally refresh the analysis results for the current area of interest by clicking the Refresh report button.
- Download feature information in CSV file, file geodatabase, or shapefile format by clicking the Download button and choosing a format.
- Print a report of the analysis results by clicking the Print button and choosing a page size and orientation.
A new window appears where you can change the report title or comments.